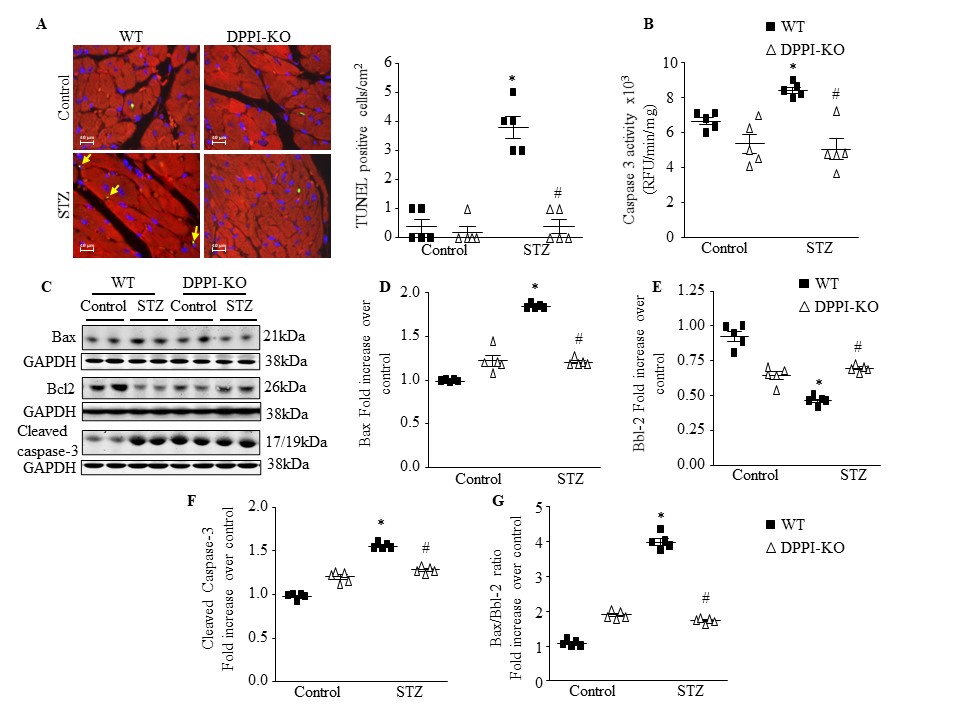
Fig. 6. Myocardial cell apoptosis assessed by TUNEL staining and cardiac caspase-3 protein expression before and after diabetes induction. (A) Left ventricular (LV) tissue sections were assessed for apoptosis with the use of the terminal deoxynucleotidyl transferase dUTP nick end-labeling (TUNEL) assay (green), tropomyosin (red), and DAPI (4',6-diamidino-2-phenylindole; blue) staining and the number of TUNELpositive myocytes was expressed as a percentage of total nuclei detected by DAPI staining (600X magnification with scale bars 40 μm). (B) Quantification of caspase-3 activity in LV with the use of caspase-3–specific fluorogenic substrate. RFU indicates relative fluorescence units. Immunoblot analysis and quantification of cardiac expression of Bax (C & D), Bcl-2 (C & E) and cleaved caspase-3 (C & F). (G) Bax/Bcl-2 ratio. Data are presented as mean ± SEM. n=5 for each group. *=p< 0.05 vs control and #=p<0.05 vs STZ-treated WT. Oneway ANOVA followed by the Tukey post hoc test was used to compare multiple groups.